Astromech20040430

|
ECONOMY STATS
by Raph "Holocron" Koster | Live Server Report Date: April 30th 2004
MMO economies are hard. It's kinda become a truism by now. There's models for closed economies and open ones, there's terms lifted from real economics thrown around, and lots of theory about faucet-drain economies, mudflation, and whatnot. Why bother? Well, mostly because the game gets more boring when the economy is out of whack. If too much money is entering the system, then players tend to have more stuff than they should be able to afford, and that makes the game easier, which then can make it kind of dull. So the health of the game economy is something that we pay pretty close attention to.
SWG uses what is called a faucet-drain economy. You can visualize a spigot of cash coming into the game, a big ol' sink where the money sloshes around, and a set of drains where the money goes out the bottom. When money comes in from the faucet, it's actually being "minted" - it's being created by the game system. The sink is basically the whole game. It's the bank accounts, the player inventories, all the money that is used for trades and transactions among players, etc. When money goes out the bottom, it's deleted from the system, rather than circulating back to a central bank.
(Credits aren't the only thing that is generated, of course - a significant faucet into the game economy actually comes in the form of resource mining. Since the amount of money and the amount of resources coming into the game at a time both vary, you get small fluctuations in the price of resources as the value of both the resources and the currency changes. Plus, you also get different qualities of resources that affect the price. But we're not really talking about commodities pricing today, much as just about the value of a credit).
We try to monitor the broad flow of cash in order to assess the health of the credit as a currency. There are other metrics for measuring the health of an economy overall - for example, the amount of transactions and the amount of currency that changes hands between players - but today we're going to just look at the flow of currency itself.
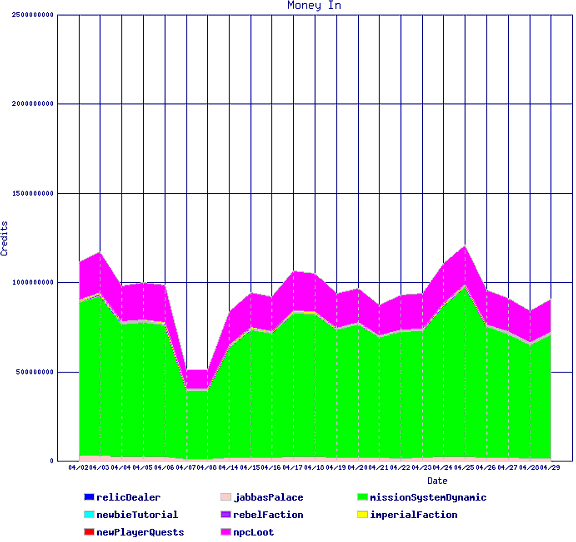
The four biggest tools we use in order to assess the health of the currency are reports on the flow in and out of money, and the percentage breakdown of where the money comes from and goes. For example, have a look at this graph:
|
What you see here is the raw amount of cash coming into the game over the course of the last month. It does tend to fluctuate up and down based on how many people are playing (which varies per day of the week), what they're doing, and so on. When we do major changes to the game (such as adding or removing a source of loot, let's say) the amount of currency flowing in tends to change.
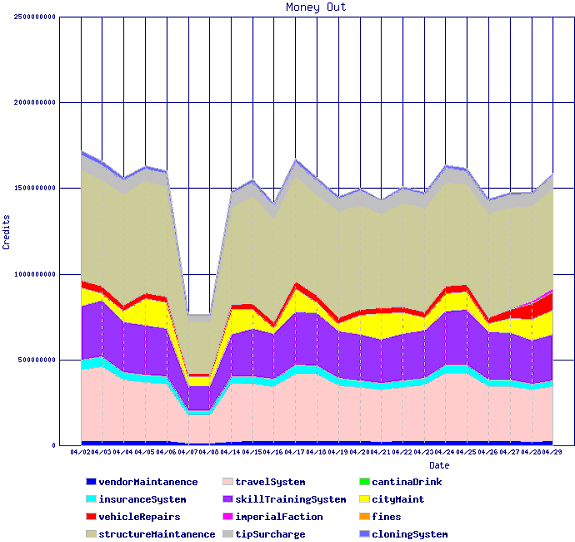
We mostly watch this one in comparison to the amount of currency flowing out, which looks like this:
|
As you can see, the variety of outflow sources is much greater. We've been more successful at having a variety of ways for you to spend your money than a variety of ways for you to make money!
Those of you with sharp eyes may have noticed that in fact the game economy is running at a net loss, based on those two graphs. A while back we noticed that the game was running at a deficit, and yet there were none of the major effects we'd expect, such as currency becoming incredibly hard to come by, people going bankrupt, etc. Our conclusion was that a lot of the currency out there must have been "counterfeit" - in other words, we had a dupe bug. We promptly started hunting for it, and in fact we not only found it, but were able to mass ban a large number of folks who were clearly involved as well as removed trillions of credits from holding accounts, middlemen, etc. Running the overall currency flow at a deficit is effectively "eating up" the duped credits, and we'll return to the game economy to a more even keel when the total amount of cash in the system is something we're more comfortable with.
|
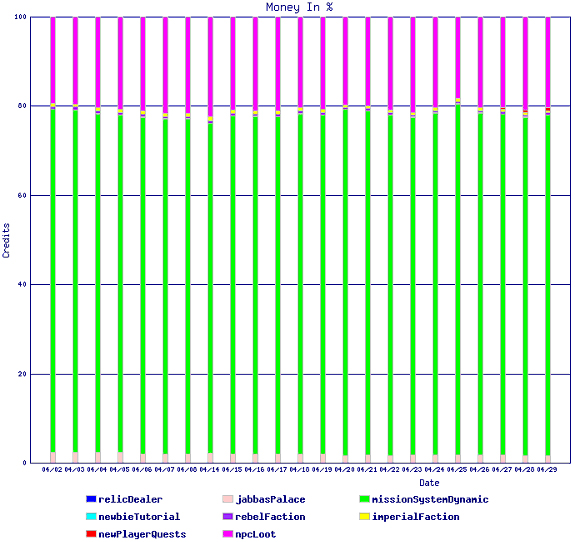
The graph above shows the percentage breakdown over the course of the last month for where people get their money. As you can see, the vast majority of the money coming in enters the system via missions. Loot runs in a distant second place.
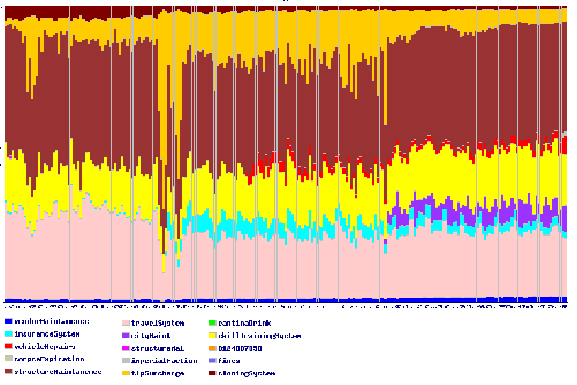
Looking back at a long-term history of expenditures even lets you see when major features went into the game:
|
The red appears when vehicle maintenance kicks in, the purple is the arrival of player cities, and the light blue is when we made adjustments to the cost of player insurance.
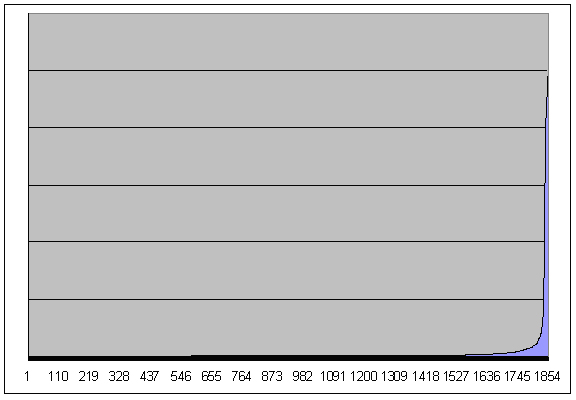
In addition to these sorts of tracking, we also monitor things like large changes in wealth for individuals (often, but not always, a sign of cheating or duping), wealth distribution across the playerbase, and so on. For example, it's easy to see that just like in the real world economy, the chacteristic "Pareto Law" distribution of cash holds true: most of the money is in the hands of a few. This is a graph of just the top 2000 or so folks on Bria, for example - the highest folks are billionaires.
|
This isn't necessarily something to be discouraged by - rather, we take it as a sign that the game economy is replicating characteristics of the real world economy. Since one of our goals was to have a game economy that can provide ongoing interesting strategy gameplay, seeing real world patterns manifest is something we were looking forward to.
There's a ton of other types of data we track, and you've seen some of them in other features. But game economy is one of the most important, because overall health of the currency is one of the quickest ways to see if the game is going sour. You can even do some of this yourself - try monitoring the fluctuations in the prices of different items on a day to day basis, and build your own graphs. If you're a stats geek like me, it'll open your eyes to a whole new way of looking at online worlds.